Launch page study charts
Share these charts with a link to the full study and methodology. They use the frozen November 3, 2026 study cohort; newer scan snapshots can differ. A static homepage scan does not measure conversion.
Launch score distribution
Number of pages in each launch score band.
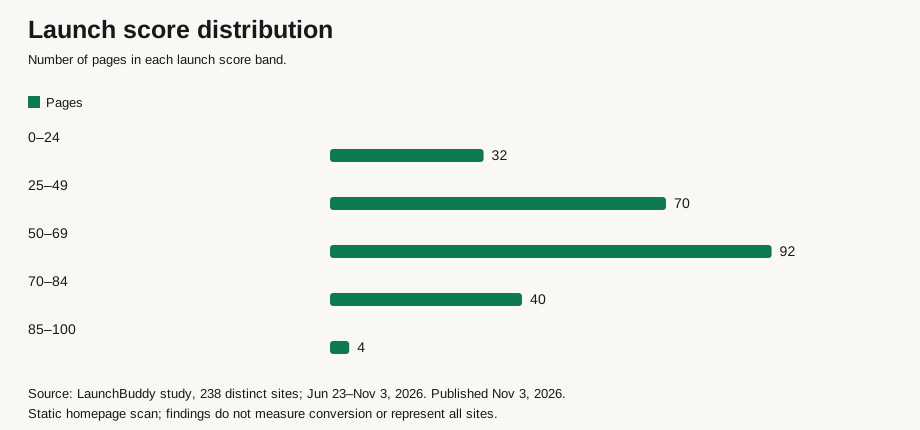
Source: LaunchBuddy study, 238 distinct sites; Jun 23–Nov 3, 2026. Published Nov 3, 2026. Read the study.
Data table
| Item | Pages |
|---|---|
| 0–24 | 32 |
| 25–49 | 70 |
| 50–69 | 92 |
| 70–84 | 40 |
| 85–100 | 4 |
Average dimension scores
Average score on each launch-readiness dimension as a percentage of its maximum.
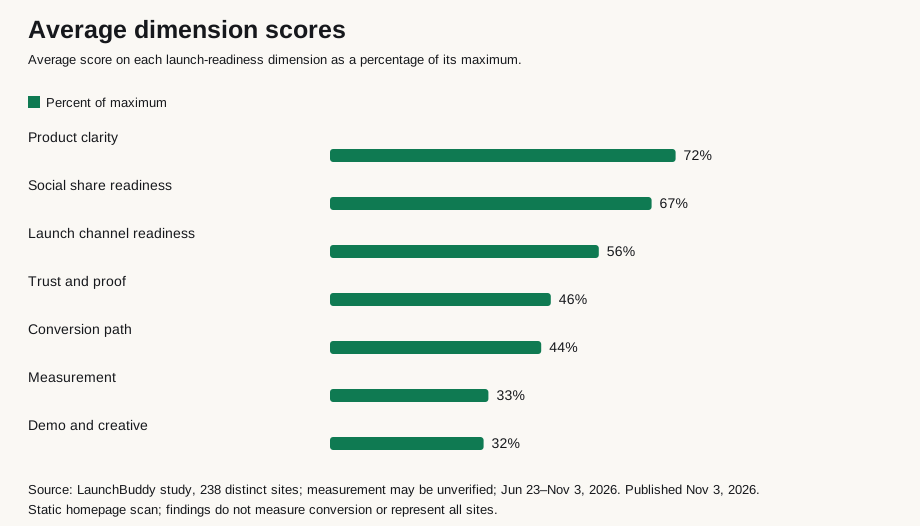
Source: LaunchBuddy study, 238 distinct sites; measurement may be unverified; Jun 23–Nov 3, 2026. Published Nov 3, 2026. Read the study.
Data table
| Item | Percent of maximum |
|---|---|
| Product clarity | 72% |
| Social share readiness | 67% |
| Launch channel readiness | 56% |
| Trust and proof | 46% |
| Conversion path | 44% |
| Measurement | 33% |
| Demo and creative | 32% |
Checklist items marked missing, by score
Percent of checklist pages marked missing each item, comparing high and low scoring groups.
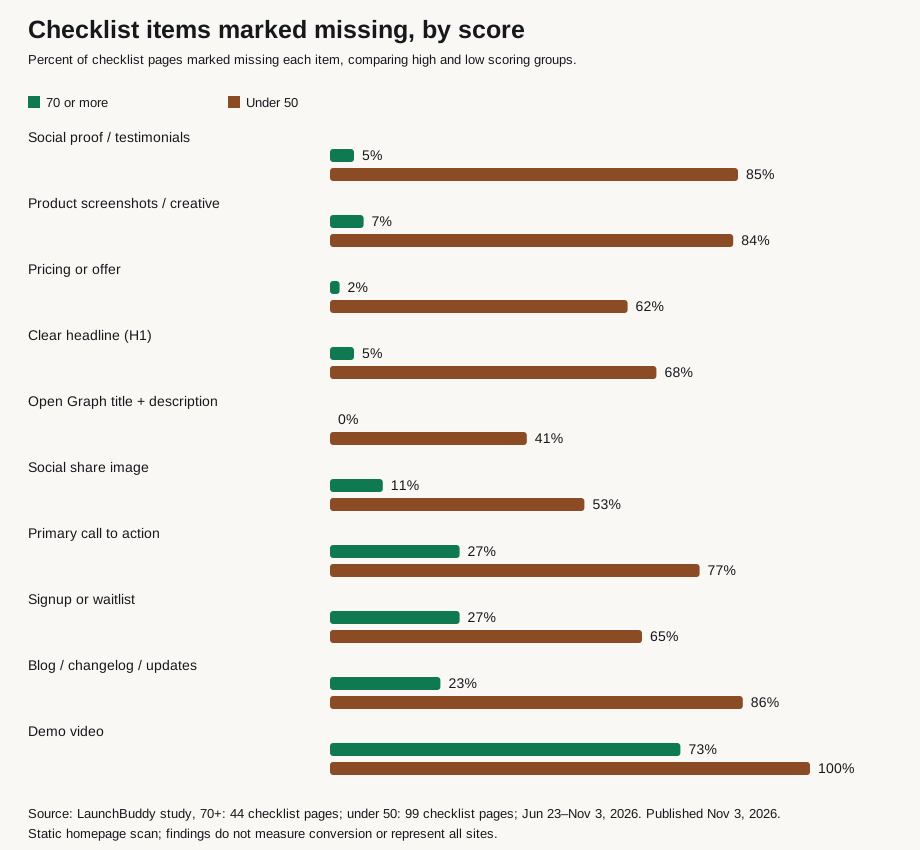
Source: LaunchBuddy study, 70+: 44 checklist pages; under 50: 99 checklist pages; Jun 23–Nov 3, 2026. Published Nov 3, 2026. Read the study.
Data table
| Item | 70 or more | Under 50 |
|---|---|---|
| Social proof / testimonials | 5% | 85% |
| Product screenshots / creative | 7% | 84% |
| Pricing or offer | 2% | 62% |
| Clear headline (H1) | 5% | 68% |
| Open Graph title + description | 0% | 41% |
| Social share image | 11% | 53% |
| Primary call to action | 27% | 77% |
| Signup or waitlist | 27% | 65% |
| Blog / changelog / updates | 23% | 86% |
| Demo video | 73% | 100% |
Biggest gap named by the scan
Share of scanned pages assigned each primary gap. Percentages are rounded.
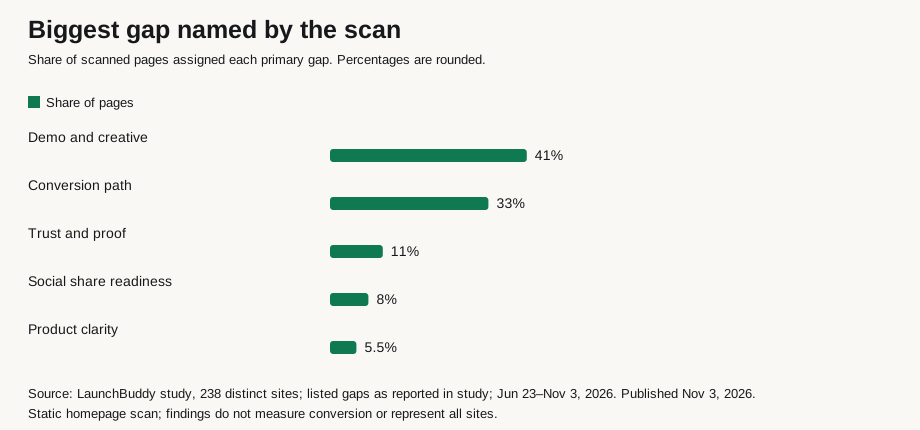
Source: LaunchBuddy study, 238 distinct sites; listed gaps as reported in study; Jun 23–Nov 3, 2026. Published Nov 3, 2026. Read the study.
Data table
| Item | Share of pages |
|---|---|
| Demo and creative | 41% |
| Conversion path | 33% |
| Trust and proof | 11% |
| Social share readiness | 8% |
| Product clarity | 5.5% |
Checklist items marked missing
Percent of checklist pages where the scan marked each item missing.
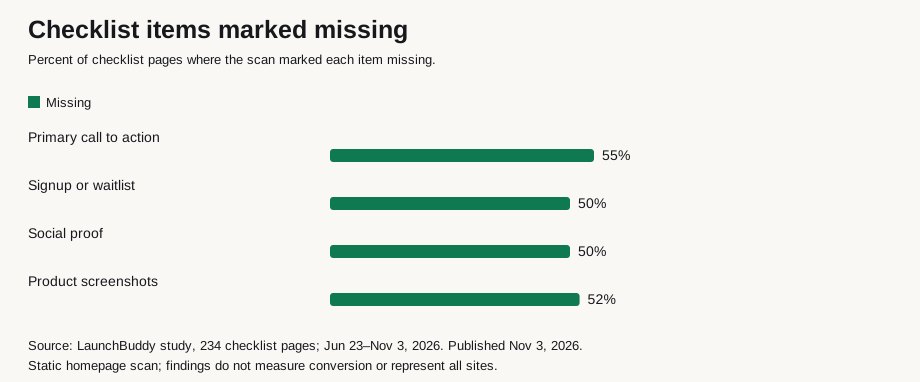
Source: LaunchBuddy study, 234 checklist pages; Jun 23–Nov 3, 2026. Published Nov 3, 2026. Read the study.
Data table
| Item | Missing |
|---|---|
| Primary call to action | 55% |
| Signup or waitlist | 50% |
| Social proof | 50% |
| Product screenshots | 52% |
Average score by site type
Average launch score among pages with a classified site type; groups are small.
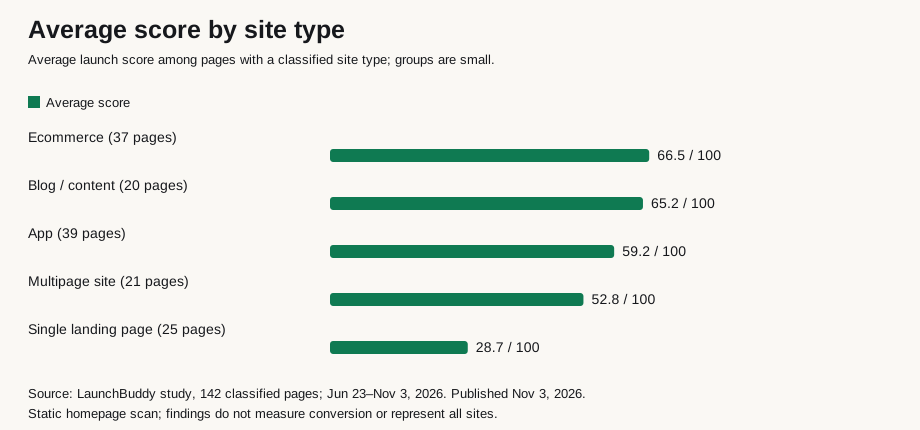
Source: LaunchBuddy study, 142 classified pages; Jun 23–Nov 3, 2026. Published Nov 3, 2026. Read the study.
Data table
| Item | Average score |
|---|---|
| Ecommerce (37 pages) | 66.5 / 100 |
| Blog / content (20 pages) | 65.2 / 100 |
| App (39 pages) | 59.2 / 100 |
| Multipage site (21 pages) | 52.8 / 100 |
| Single landing page (25 pages) | 28.7 / 100 |